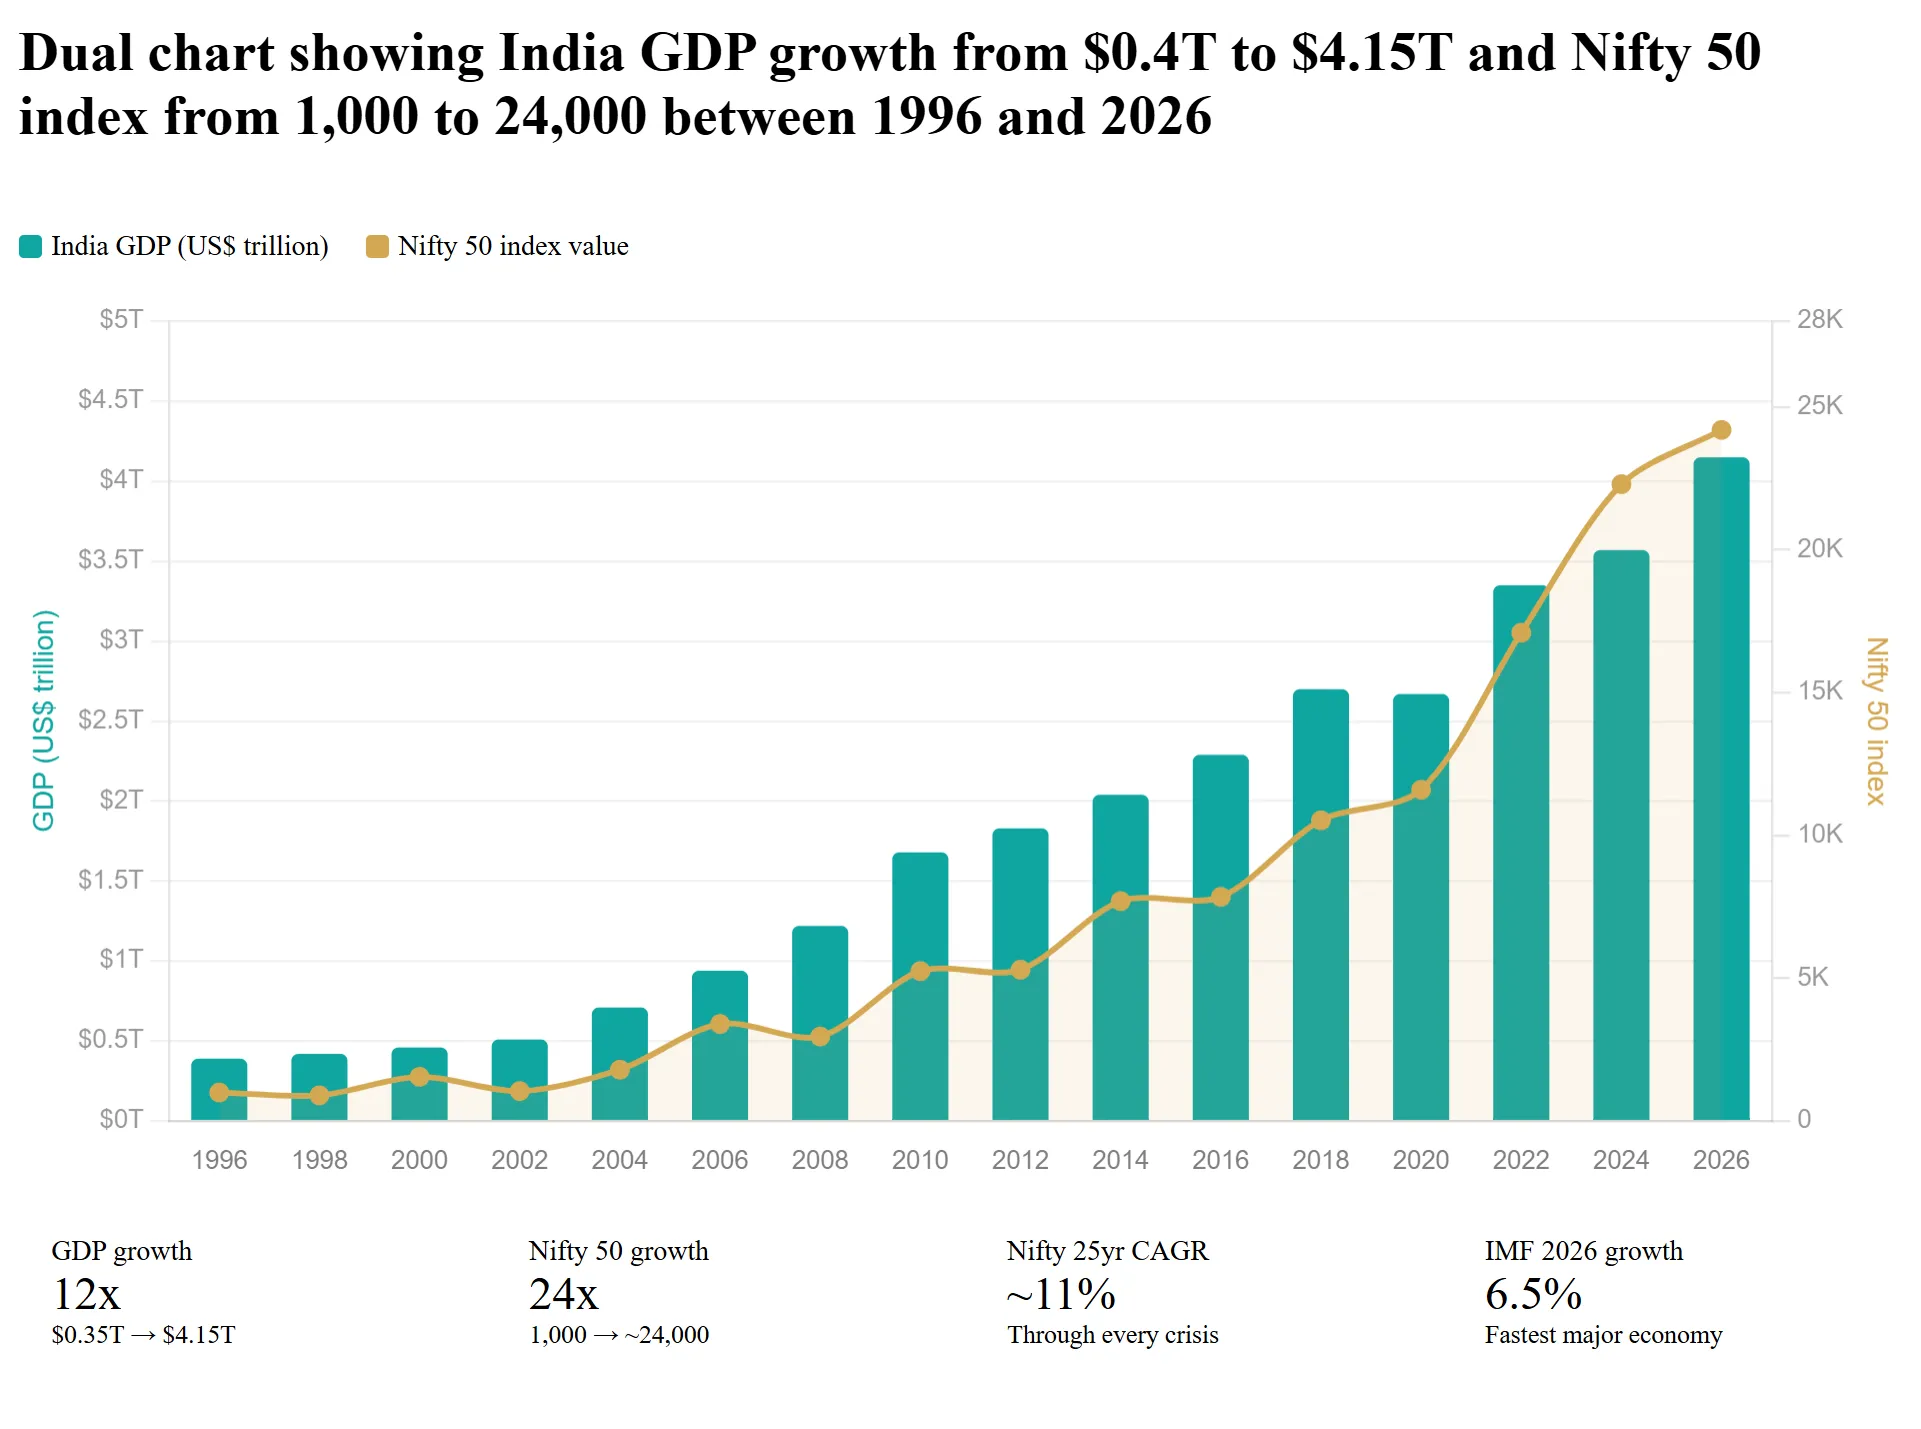
In 1995, India’s GDP was around $350 billion. The economy ranked 16th in the world. The stock market was small, volatile, and largely ignored by global investors. Most NRIs kept their Indian money in fixed deposits and property, if they invested in India at all.
Thirty years later, India’s GDP is $4.15 trillion (2026, IMF). The economy is the world’s 5th largest, having overtaken the UK, France, Italy, Brazil, Russia, Canada, and a dozen others along the way. The Nifty 50, India’s benchmark stock index, has turned ₹1 lakh invested in 1996 into over ₹24 lakh by 2026, a 25x return over 30 years.
And the story isn’t over. India is projected to grow at 6.4–6.5% annually through 2026–27, the fastest of any major economy in the world, according to the IMF.
This blog is about what happened, why it happened, and what it means for NRIs thinking about the next 10–20 years.
The 30-Year Transformation: $350 Billion to $4.15 Trillion
India’s economic journey over the last three decades reads like a compounding story in itself.
1991, The turning point
India liberalised its economy after a severe balance of payments crisis. Import restrictions eased. Foreign investment was welcomed. The licence raj began dismantling. This single policy shift set the trajectory for everything that followed.
1995–2000, The IT revolution
India’s software services industry exploded. Companies like Infosys, TCS, and Wipro became global names. GDP grew from $350 billion to $460 billion. The Nifty 50 launched in 1996 with a base value of 1,000.
2000–2007, The infrastructure boom
Highway construction, telecom expansion, banking reforms. GDP crossed $1 trillion in 2007, a milestone that took 60 years since independence. The Nifty surged from around 1,000 to over 6,100, a 6x increase in just over a decade.
2008–2009, The global financial crisis
The Nifty crashed over 50% from its peak. Panic everywhere. NRIs who pulled out locked in losses. NRIs who stayed, or invested more during the crash, saw some of the best returns of their lives over the next decade.
2010–2014, Consolidation and reform
GDP crossed $2 trillion in 2014. Aadhaar enrollment, banking inclusion, and telecom penetration laid the digital foundations. The Nifty recovered and crossed 8,000.
2014–2020, Structural transformation
GST unified India’s fragmented tax system. The Insolvency and Bankruptcy Code (IBC) cleaned up bad loans. Digital payments exploded, UPI transactions went from zero to billions per month. GDP approached $3 trillion before COVID hit.
2020, The COVID shock
GDP contracted 5.8% in 2020, the sharpest decline since independence. Markets crashed. But India bounced back faster than almost any major economy.
2021–2026, The acceleration
GDP crossed $3 trillion in 2021, $3.5 trillion in 2023, and $4.15 trillion in 2026. India overtook the UK in 2022 to become the 5th largest economy. In April 2025, it temporarily surpassed Japan to become the 4th largest. The Nifty 50 crossed 24,000, reflecting corporate earnings growth across banking, IT, energy, and consumer sectors. Cumulative FDI inflow crossed $1.12 trillion since 2000.
In January 2026, India and the EU agreed on what’s being called the largest free trade agreement either has signed, reducing tariffs on over 90% of goods. This opens new export markets and reinforces India’s position as a global manufacturing and services hub.
The Nifty 50: What Patience Actually Looks Like
The Nifty 50 is the heartbeat of India’s equity market,50 of the largest, most liquid companies listed on the National Stock Exchange. Launched in April 1996 at a base value of 1,000, it currently sits around 24,000.
That’s a 24x increase over 30 years. But the journey to get there was anything but smooth.
The Nifty has crashed 50%+ twice (2008 and 2020). It has delivered negative returns in 8 of the last 30 calendar years. In 2008 alone, it fell 52%. In 2011, it dropped 25%. In the first quarter of 2020, it fell 38% in weeks.
Every single time, it recovered. Every single time, investors who stayed in were rewarded.
Here's the data that matters most
Over every rolling 7-year period since the Nifty 50’s inception, the index has never delivered a negative return. Not once. The minimum 7-year CAGR was 0% (ending 2001, which started from the dot-com peak). The average 7-year CAGR: 11.2%.
Over 10-year periods, the average CAGR is 11–12% with zero negative periods. Over 20-year periods, the CAGR narrows to a remarkably consistent 11–12% band. Over 25-year periods, the range compresses further to 8.7–13.2%, regardless of starting point.
₹1 lakh invested in the Nifty 50 in 1996 is worth approximately ₹24 lakh today. That’s a CAGR of approximately 11%. Not spectacular in any single year. But compounded over 30 years, it’s life-changing money.
An NRI who started a SIP of ₹15,000 per month in 2006 and continued through the 2008 crash, the 2011 correction, the 2015 slowdown, the 2020 pandemic, and every wobble in between, that ₹36 lakh invested is worth well over ₹1.2 crore today. The investor who stopped their SIP during the 2008 crash? They missed the recovery that delivered the highest returns.
Patience isn’t a platitude in Indian markets. It’s the strategy.
Why the Next 10–20 Years Could Be Even Stronger
India’s first 30 years of growth were powered by liberalisation, IT services, and infrastructure. The next phase has different, and arguably stronger, structural drivers.
Demographics
India has the world’s largest working-age population. Median age: 28 years (vs 38 in China, 40 in the US, 47 in Japan). This demographic dividend, more earners, more consumers, more taxpayers, is projected to last until at least 2055. No other major economy has this advantage at this scale.
Digitalisation
India processes over 14 billion UPI transactions per month (2025). The digital public infrastructure, Aadhaar, UPI, GST Network, Account Aggregator, has no equivalent anywhere in the world. This reduces transaction costs, formalises the economy, and expands the tax base.
Manufacturing shift
Global supply chains are diversifying away from China. India’s Production-Linked Incentive (PLI) schemes across 14 sectors, electronics, semiconductors, pharma, automobiles, solar, are attracting factory investment that previously went exclusively to Southeast Asia.
Domestic consumption
With 1.4 billion people and a rising middle class, India’s domestic market is enormous and growing. Consumer spending drives approximately 55% of GDP. As incomes rise, so does demand for financial services, healthcare, education, housing, and branded goods, all of which feed corporate earnings.
Global positioning
The India-EU FTA agreed in January 2026 opens European markets to Indian exports. India is now a member of or participant in virtually every major multilateral economic forum. The country’s foreign exchange reserves stood at $687 billion as of January 2026, a buffer against external shocks.
IMF projections for India
6.4% growth in 2025, 6.5% in 2026, the fastest among all major economies. By comparison, the US is projected at 1.9%, the EU at 1.0%, China at 4.8%, Japan at 0.7%.
What This Means for NRIs
You’re watching this growth story from abroad. Your salary is in dollars, pounds, dirhams, or Australian dollars. The question isn’t whether India is growing, that’s settled. The question is whether you’re participating in that growth.
The currency angle works in your favour. The rupee depreciates against most major currencies by 3–4% annually over the long term. This means your foreign earnings buy more rupees each year. An NRI who converts GBP or USD to INR today gets more purchasing power than one who waits. And if Indian equity markets continue delivering 11–12% in INR terms, even after adjusting for currency depreciation, the net return in your home currency is 7–9%, significantly above most developed market alternatives.
The compounding case is mathematical, not emotional. ₹25,000 per month invested at 12% CAGR for 20 years becomes approximately ₹2.5 crore. The same amount for 10 years: approximately ₹58 lakh. The difference between starting now and starting in 10 years isn’t 10 years of returns, it’s the compounding on those 10 years of returns. The cost of delay is measured in crores, not lakhs.
You don’t need to pick stocks. Diversified equity mutual funds, large cap, flexi cap, index funds tracking the Nifty 50, give you exposure to India’s growth story without the need to monitor individual companies from a different time zone. A monthly SIP handles the discipline automatically. For fund category guidance, see our best mutual funds for NRIs guide.
The setup is a one-time effort. NRE account, PAN, KYC, fund selection, the initial setup takes a few weeks. After that, your SIP runs automatically. You review your portfolio quarterly or annually. The Indian economy does the heavy lifting while you focus on your career abroad. For allocation guidance, see how much NRIs should invest in India.
The Only Risk Is Not Starting
India will have corrections. Markets will crash again, probably more than once in the next 20 years. GDP growth will slow in some quarters. There will be geopolitical tensions, policy surprises, and global recessions.
None of this changes the long-term trajectory. The Nifty 50 has survived two 50%+ crashes, a pandemic, a global financial crisis, three changes of government, and a currency that’s depreciated every decade, and still delivered 11% CAGR over 30 years.
The NRIs who built wealth in India weren’t smarter than everyone else. They just started, and they didn’t stop.
Our team works with NRIs across the US, UK, UAE, Canada, Australia, and Singapore to build India investment portfolios aligned with long-term goals. We handle the setup, fund selection, and ongoing reviews, so you can participate in India’s growth story without the operational complexity.
Frequently Asked Questions
Disclaimer: This blog is for informational purposes only and does not constitute financial, legal, or tax advice. Past performance of the Nifty 50 or any mutual fund does not guarantee future results. All GDP data is sourced from the IMF and World Bank. Nifty 50 returns are historical and subject to market risks. Mutual fund investments are subject to market risks, read all scheme-related documents carefully. Currency movements are based on historical trends and may not continue. Consult a qualified financial advisor before making investment decisions.